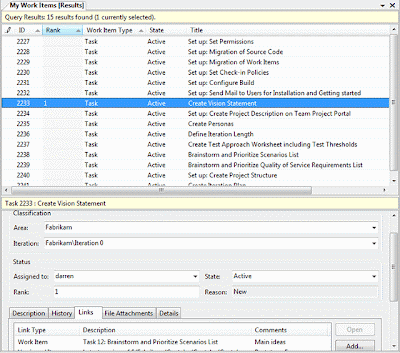
Visual Studio Work Item list:

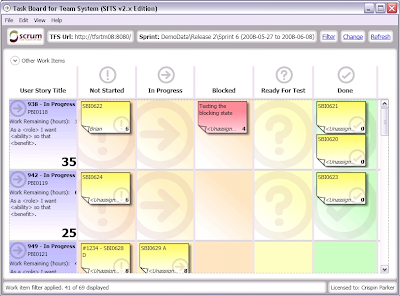
Conchango Taskboard:

From a certain project size on the Visual Studio Work Item lists just won't scale and end up with heaps of data that one can scroll through forever. Don't get me wrong, those lists are sufficient for standard tasks, but they are cumbersome for gaining insight into the project's big picture. And Conchango Taskboard is for Sprint planning and Product Backlog maintenance only. The Conchango Scrum Plugin does have a set of really nice reports though.
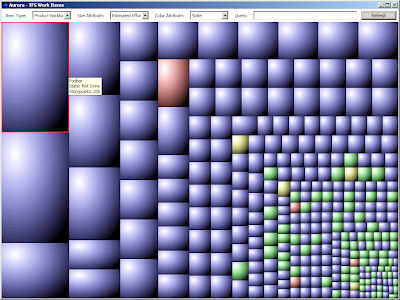
So this is where I decided to ramp up my own little solution, which would be based on rendering Work Item data into Treemaps. This week I hacked out a little prototype in my sparetime (working title "Aurora"):

This configuration example provides an overall impression of the sample project's progress: Green tasks are done, blue tasks are not done, and their size represents their complexity. And this is by no means limited to Scrum projects, it works for all kinds of TFS project templates.
Three simple input parameters are all it takes:
- Work Item type (e.g. Product Backlog Item, Sprint Backlog Item, Bug)
- Work Item attribute defining Treemap size (e.g. Storypoints or any other numeric data, or none in case all items should be rendered with equal size)
- Work Item attribute defining Treemap color (e.g. State, Sprint ID, etc)
Plus an optional query string for narrowing the list of items.
This approach possibly allows to visualize about 70% of the reports I could think of. I am still wondering how to implement the missing 30%, as they cannot be covered that easily. For instance I want to group Area Paths with equal prefixes by rendering them with the same color. Or simplify the creation of queries (can't expect everyone to know WIQL by heart). And I don't want to over-complicate things either. Any suggestions regarding those matters are highly welcome! Another requirement is to let the user define color mapping. And item hierarchies are still missing, too (that's the "Tree" in "Treemaps" after all).
By the way, I am using woopef's WPF TreeMap control, thanks a lot for making it publicly available. I am also going to open-source Aurora once it provides basic functionality and reaches a certain level of stability, most likely on CodePlex.
